Overview
Starting with WebADM 2.4.17, a monitoring console is available to graphically visualize the following information:
- Live login activity on integrated systems (requires a Client Policy per integrated system)
- License information per product
- System statistics
- Connector statuses (LDAP, SQL, Session, SMTP, PKI, Proxy)
- Recent logs
- Recent alerts
- Service metrics for OpenOTP / SpanKey and LDAP / SQL storage backends
The console aggregates this telemetry on a single page and refreshes it live, providing an at-a-glance view of authentication activity and platform health.
Accessing the Console
The Monitoring Console can be reached in two ways:
- From the WebADM Administrator Portal — open the Monitoring tab.
- Direct URL —
https://<webadm-host>/console/index.html
Example:https://webadm1.rcdevsdocs.com/console/index.html
When accessed directly, the console displays an Authentication Required prompt asking for the SSE authentication token before connecting to the monitoring stream:
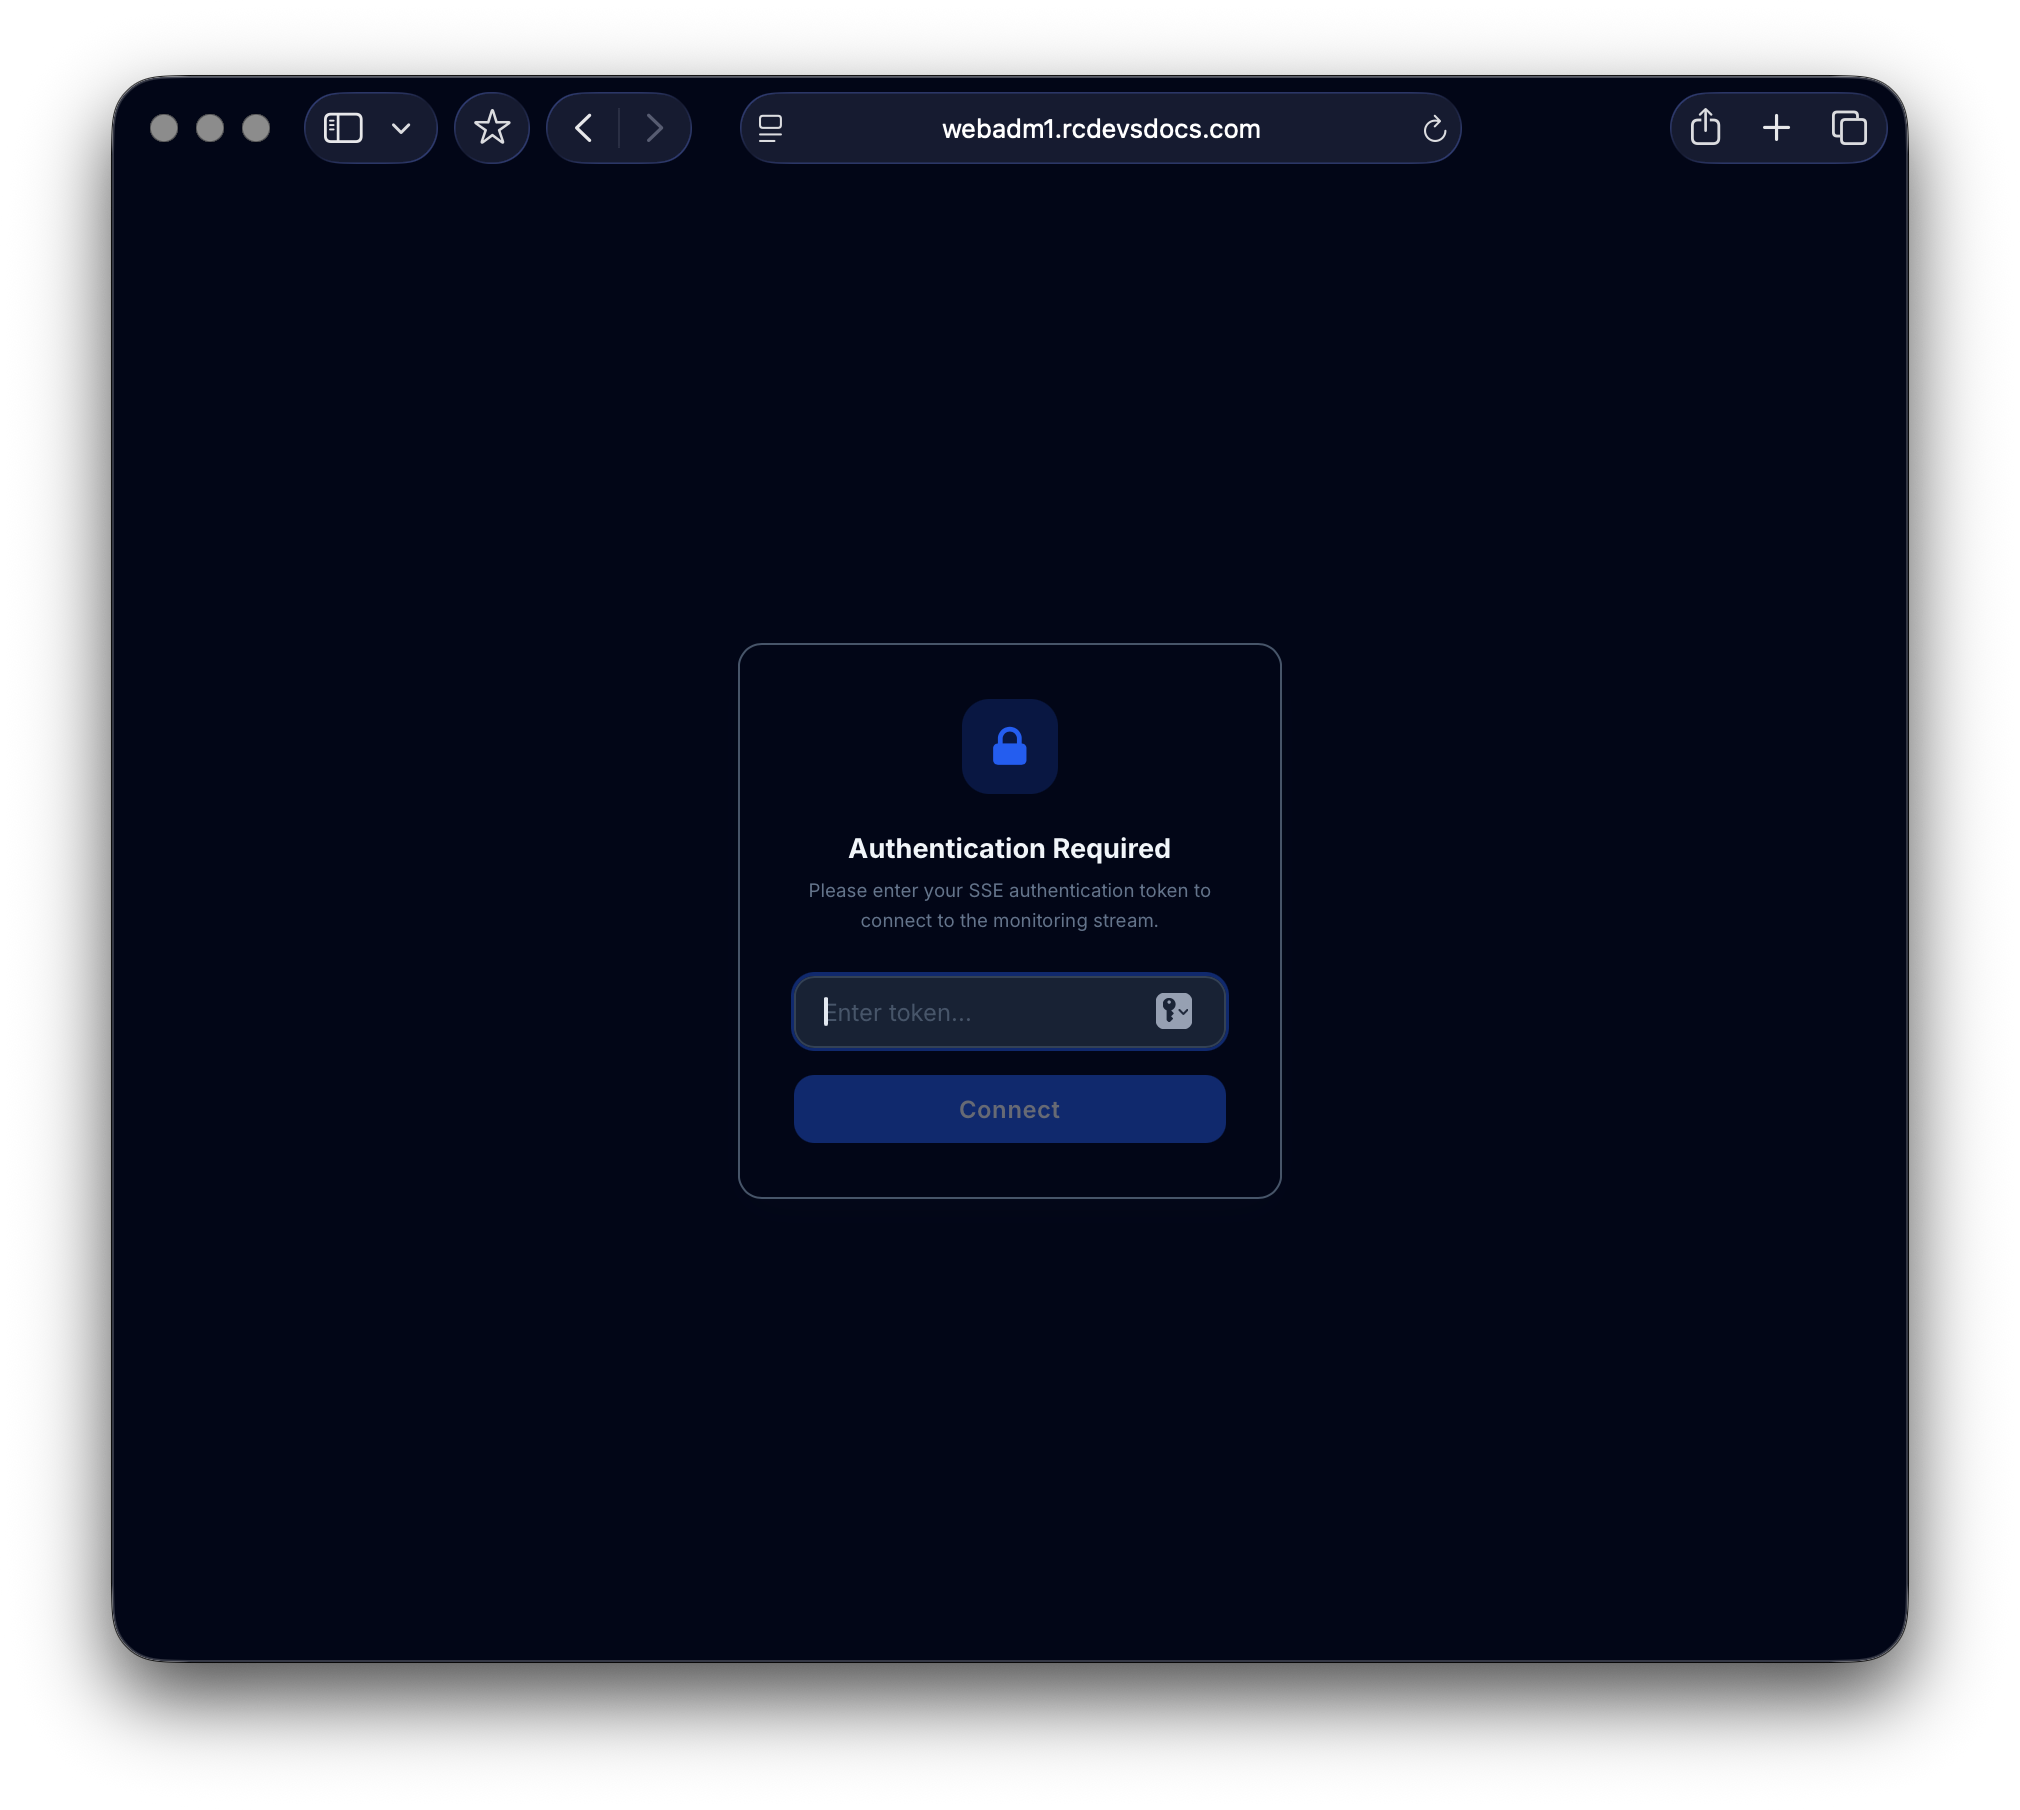
Enter the value of console_tokens configured in webadm.conf (see below) and click Connect to load the dashboard.
Enabling the Console
Console access is disabled by default and must be explicitly enabled by configuring an SSE authentication token in /opt/webadm/conf/webadm.conf.
Generate a token
Use OpenSSL to generate a strong random token:
openssl rand -hex 16
Configure the token
Edit /opt/webadm/conf/webadm.conf and set the console_tokens directive (one token per console):
# Enable monitoring consoles by setting random access tokens (1 per console).
# Use 'openssl rand -hex 16' to generate a new access token.
console_tokens "394bd4d6b2eb7a7ae057a97ca8adfa36"
For 2 or more Tokens, use the following syntax:
console_tokens "394bd4d6b2eb7a7ae057a97ca8adfa36","394bd4d6b2eb7a7ae057a97ca8adfa37"
Apply the configuration
Restart WebADM for the change to take effect:
/opt/webadm/bin/webadm restart
or
systemctl restart webadm
Connect to the console
Open https://<webadm-host>/console/index.html, paste the token into the Enter token… field, and click Connect. The dashboard will then establish the SSE stream and start displaying live data.
Security Considerations
- Treat the console token as a secret. Anyone with the token and network access to the console URL can view login activity, source IPs, geolocation, and platform metrics.
- Rotate tokens periodically and whenever an operator with knowledge of the token leaves.
- Restrict network exposure of
/console/*to trusted management networks.
Console Sections
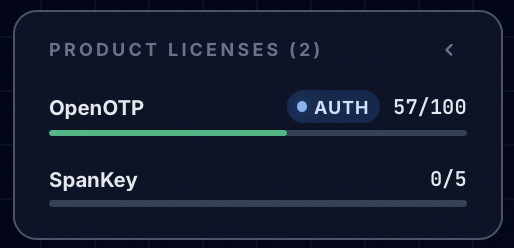
Product Licenses
Displays current usage versus license capacity for each WebADM product (e.g., OpenOTP, SpanKey).
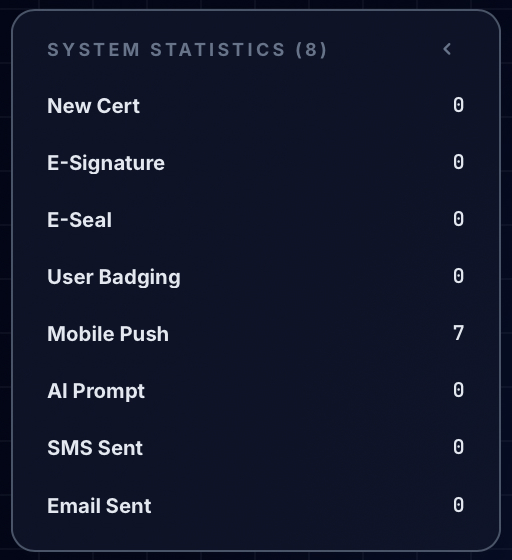
System Statistics
Counters for platform activity such as new certificates, e-signatures, e-seals, user badging, mobile push sent, AI reports, SMS sent, etc.
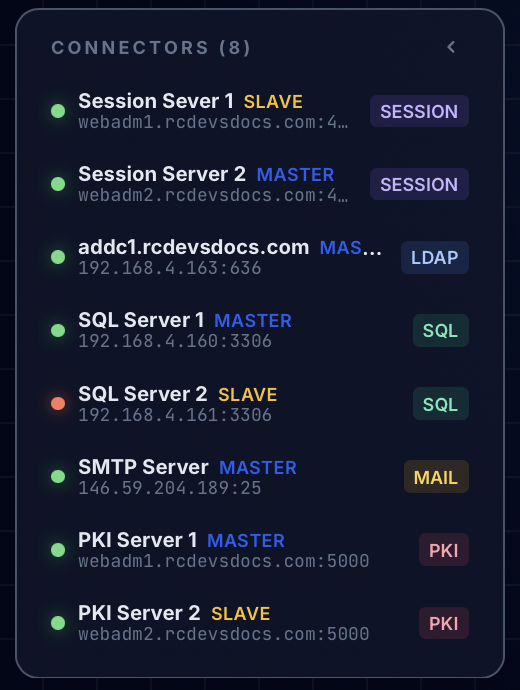
Connectors
Status indicators (up/down) for configured backends: Session Servers, LDAP directories, SQL databases, SMTP, PKI, and Proxy connectors.
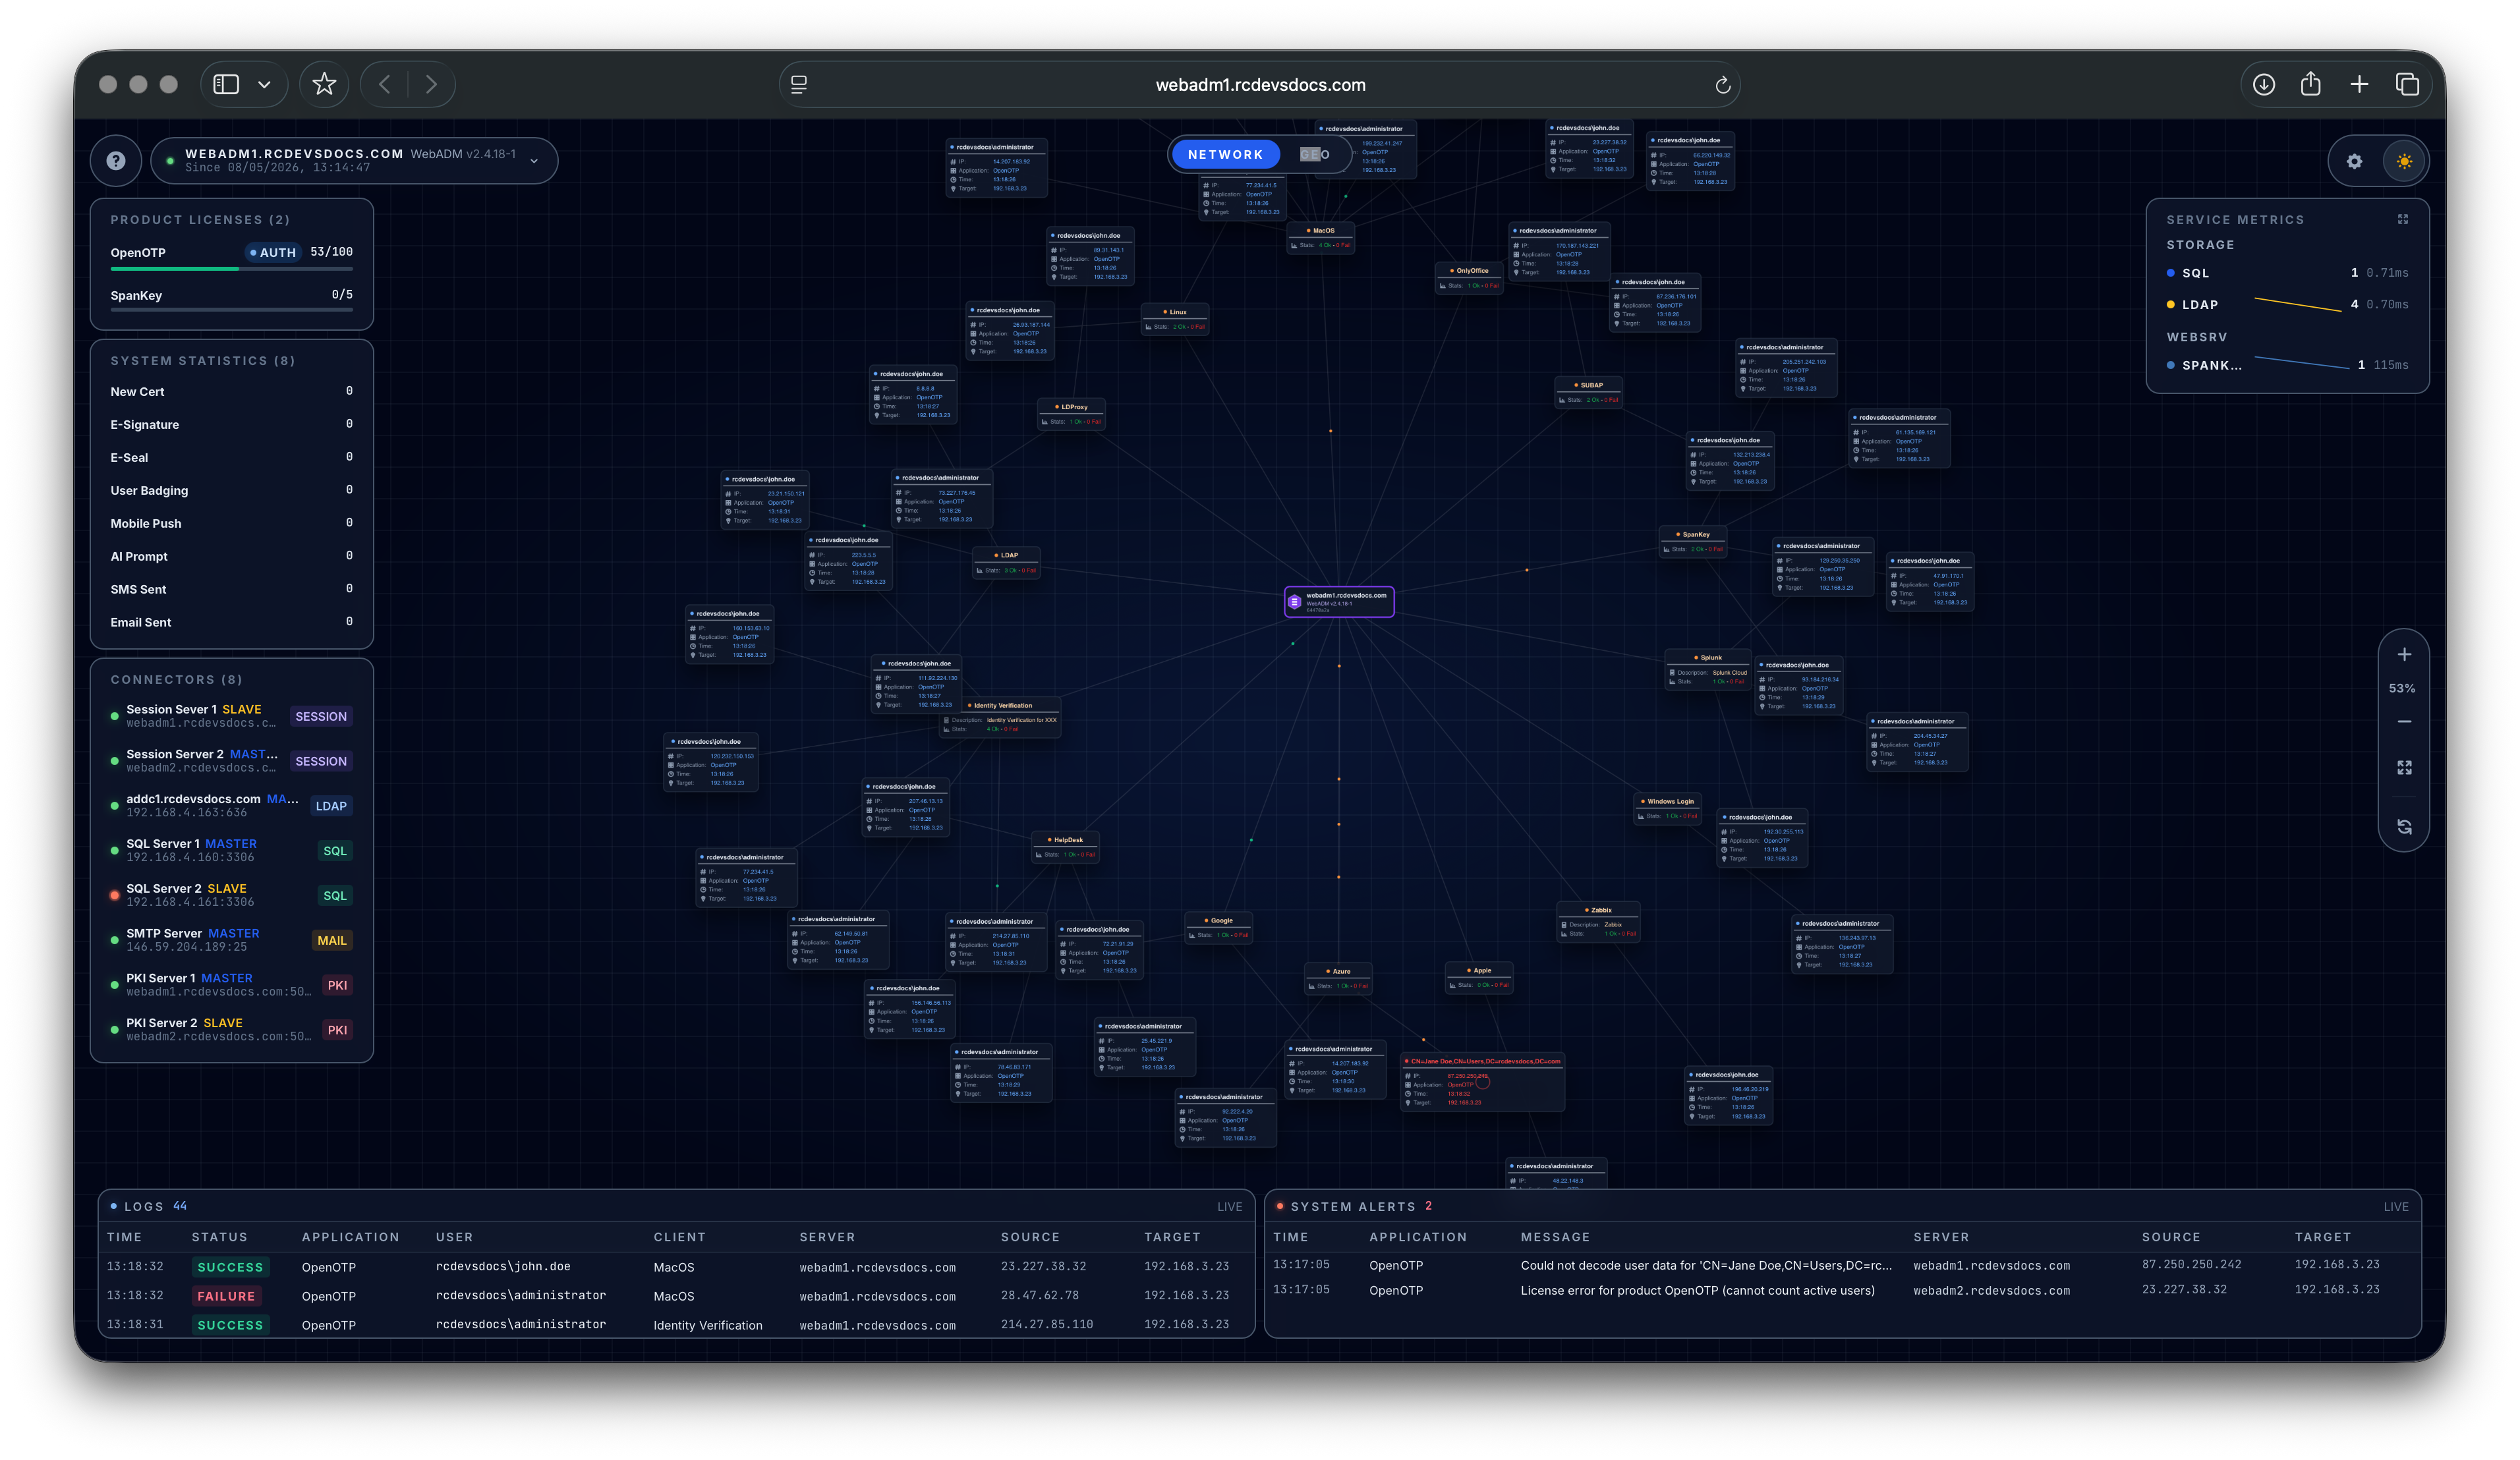
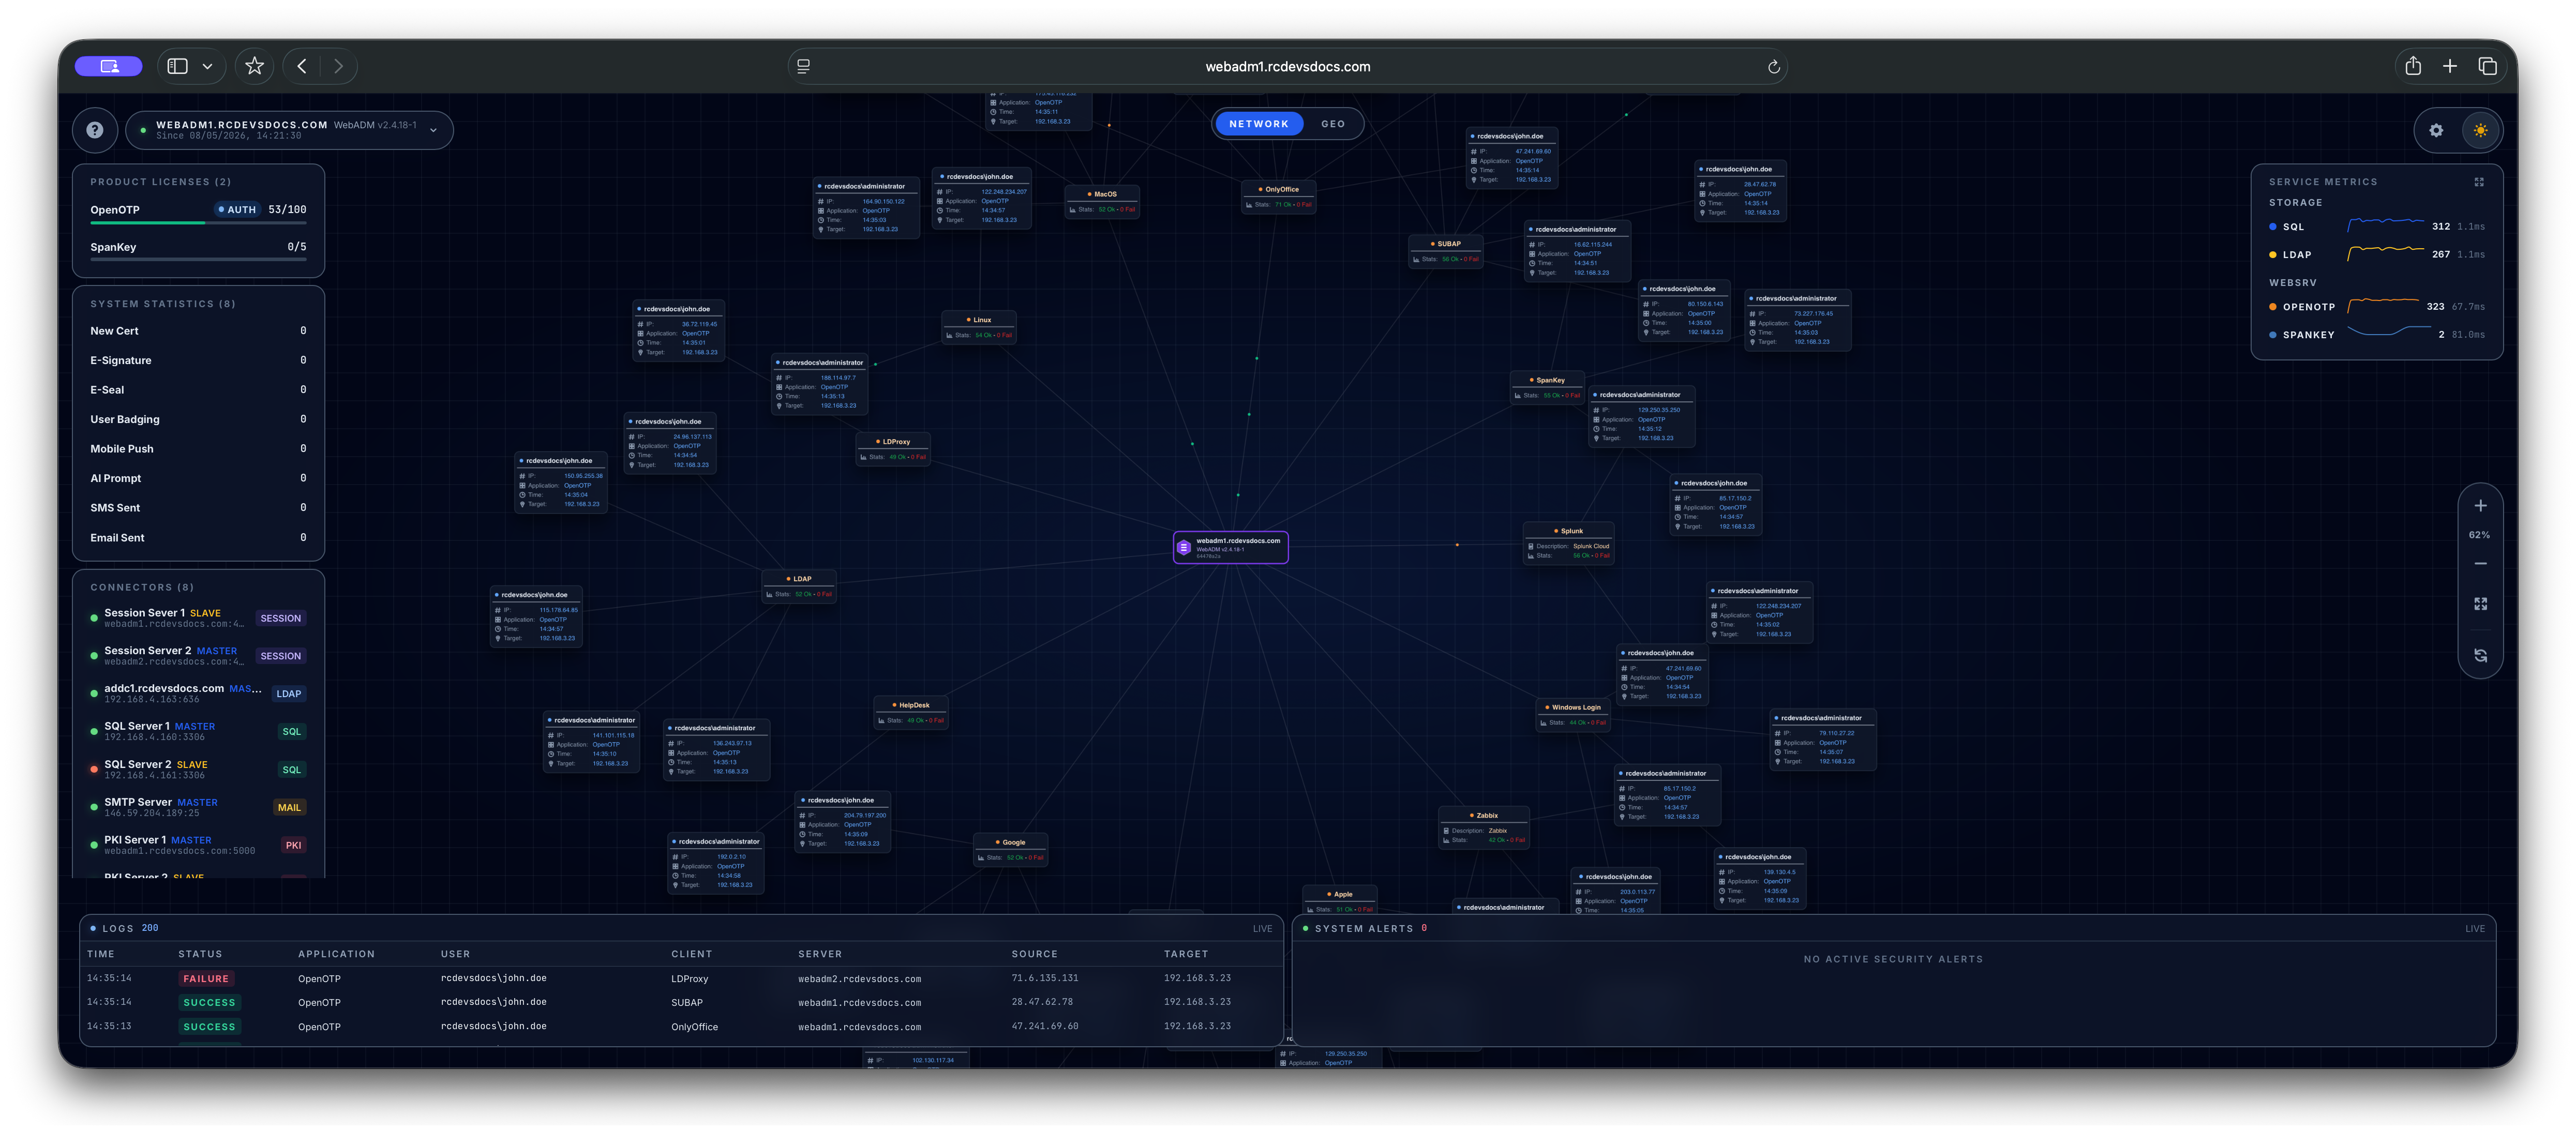
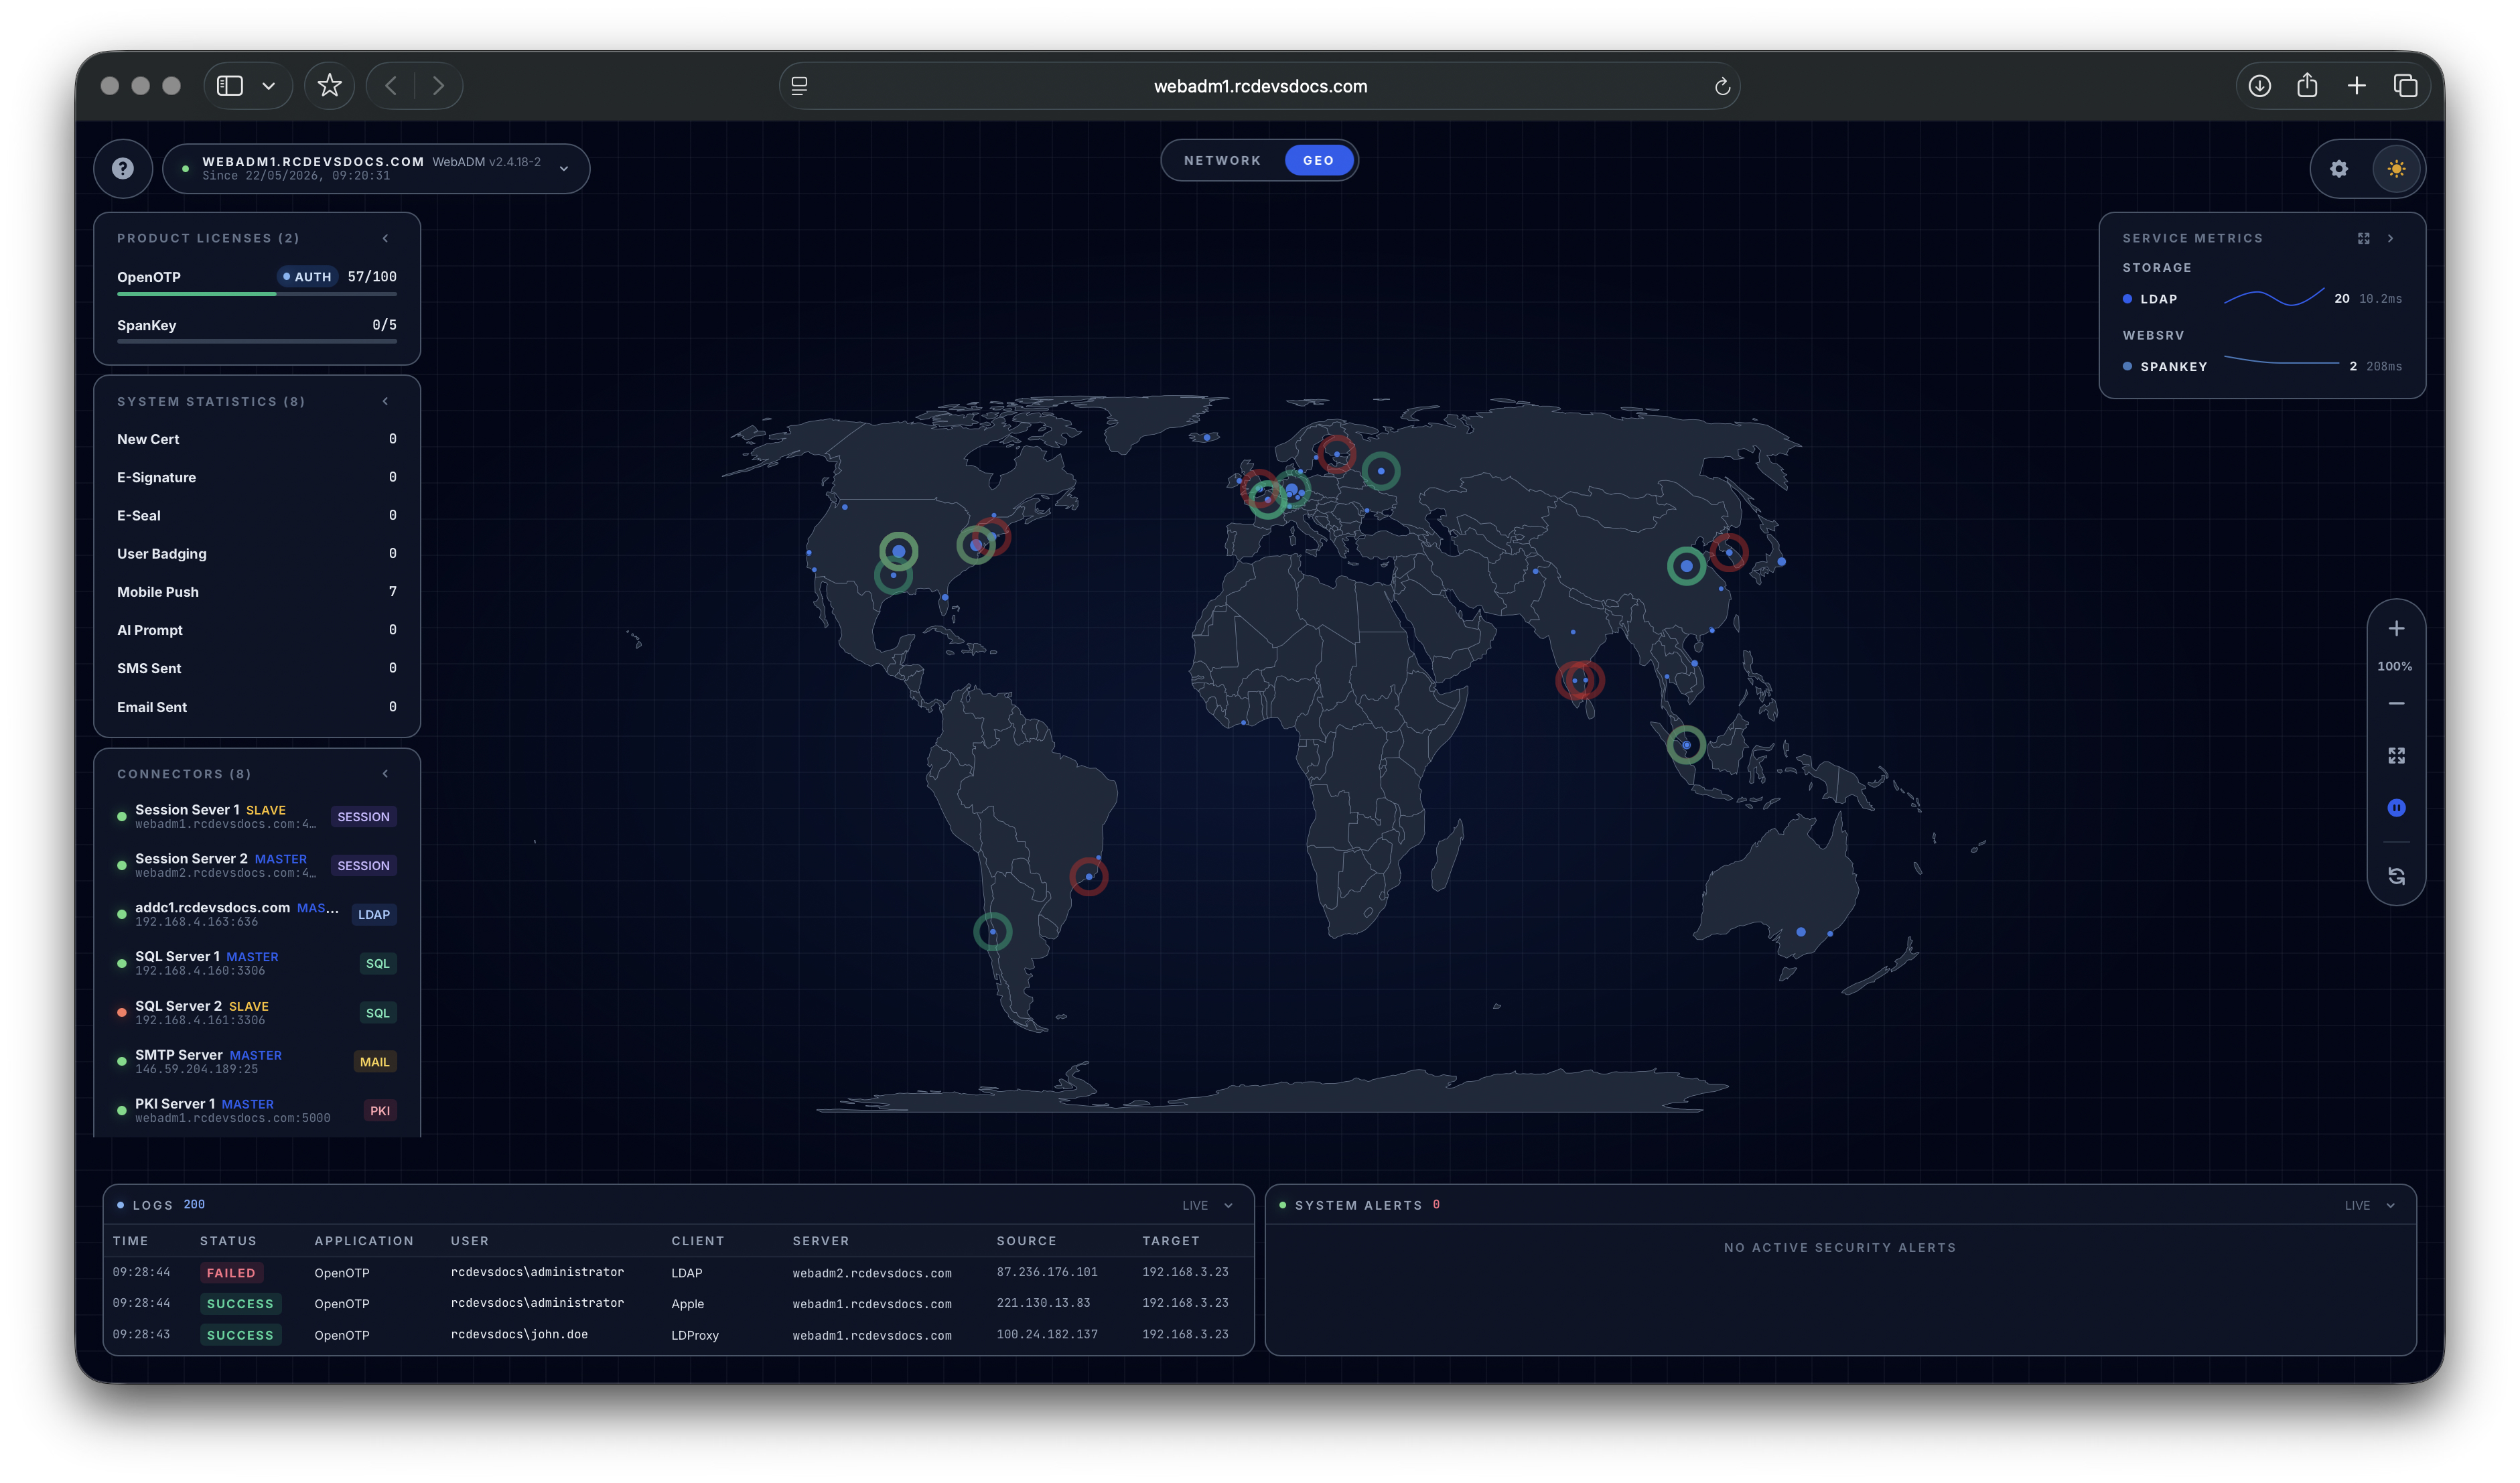
Network / Geo View
Visualizes live authentication activity. The Network view shows source-to-target relationships; the Geo view plots login sources on a world map. The source IP must be correcly forwarded to OpenOTP by the client system(s) it order to display the information.
Monitoring console network view
Monitoring console map view
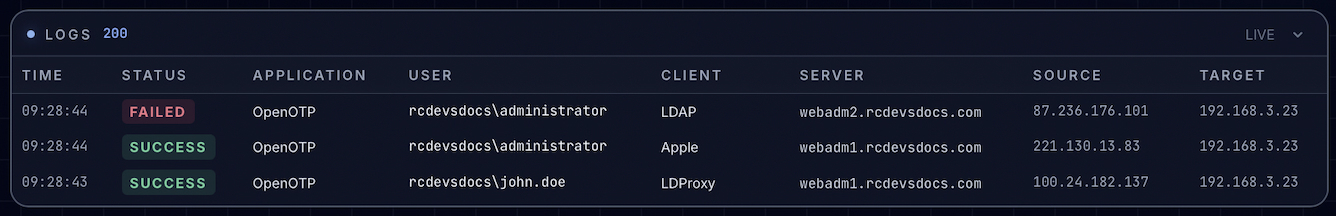
Logs
Live tail of the most recent authentication events, including timestamp, status, application, user, client, server, source IP, and target.
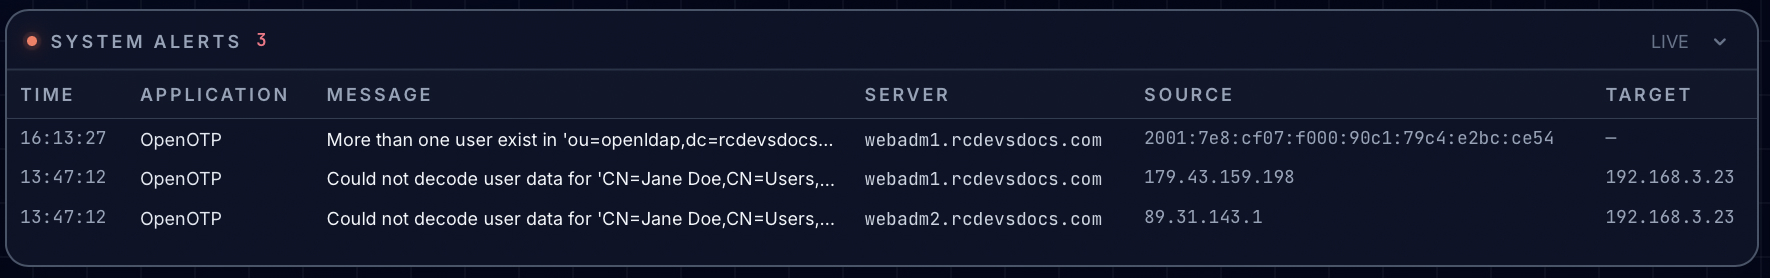
System Alerts
Active security and platform alerts. Empty when no alerts are firing.
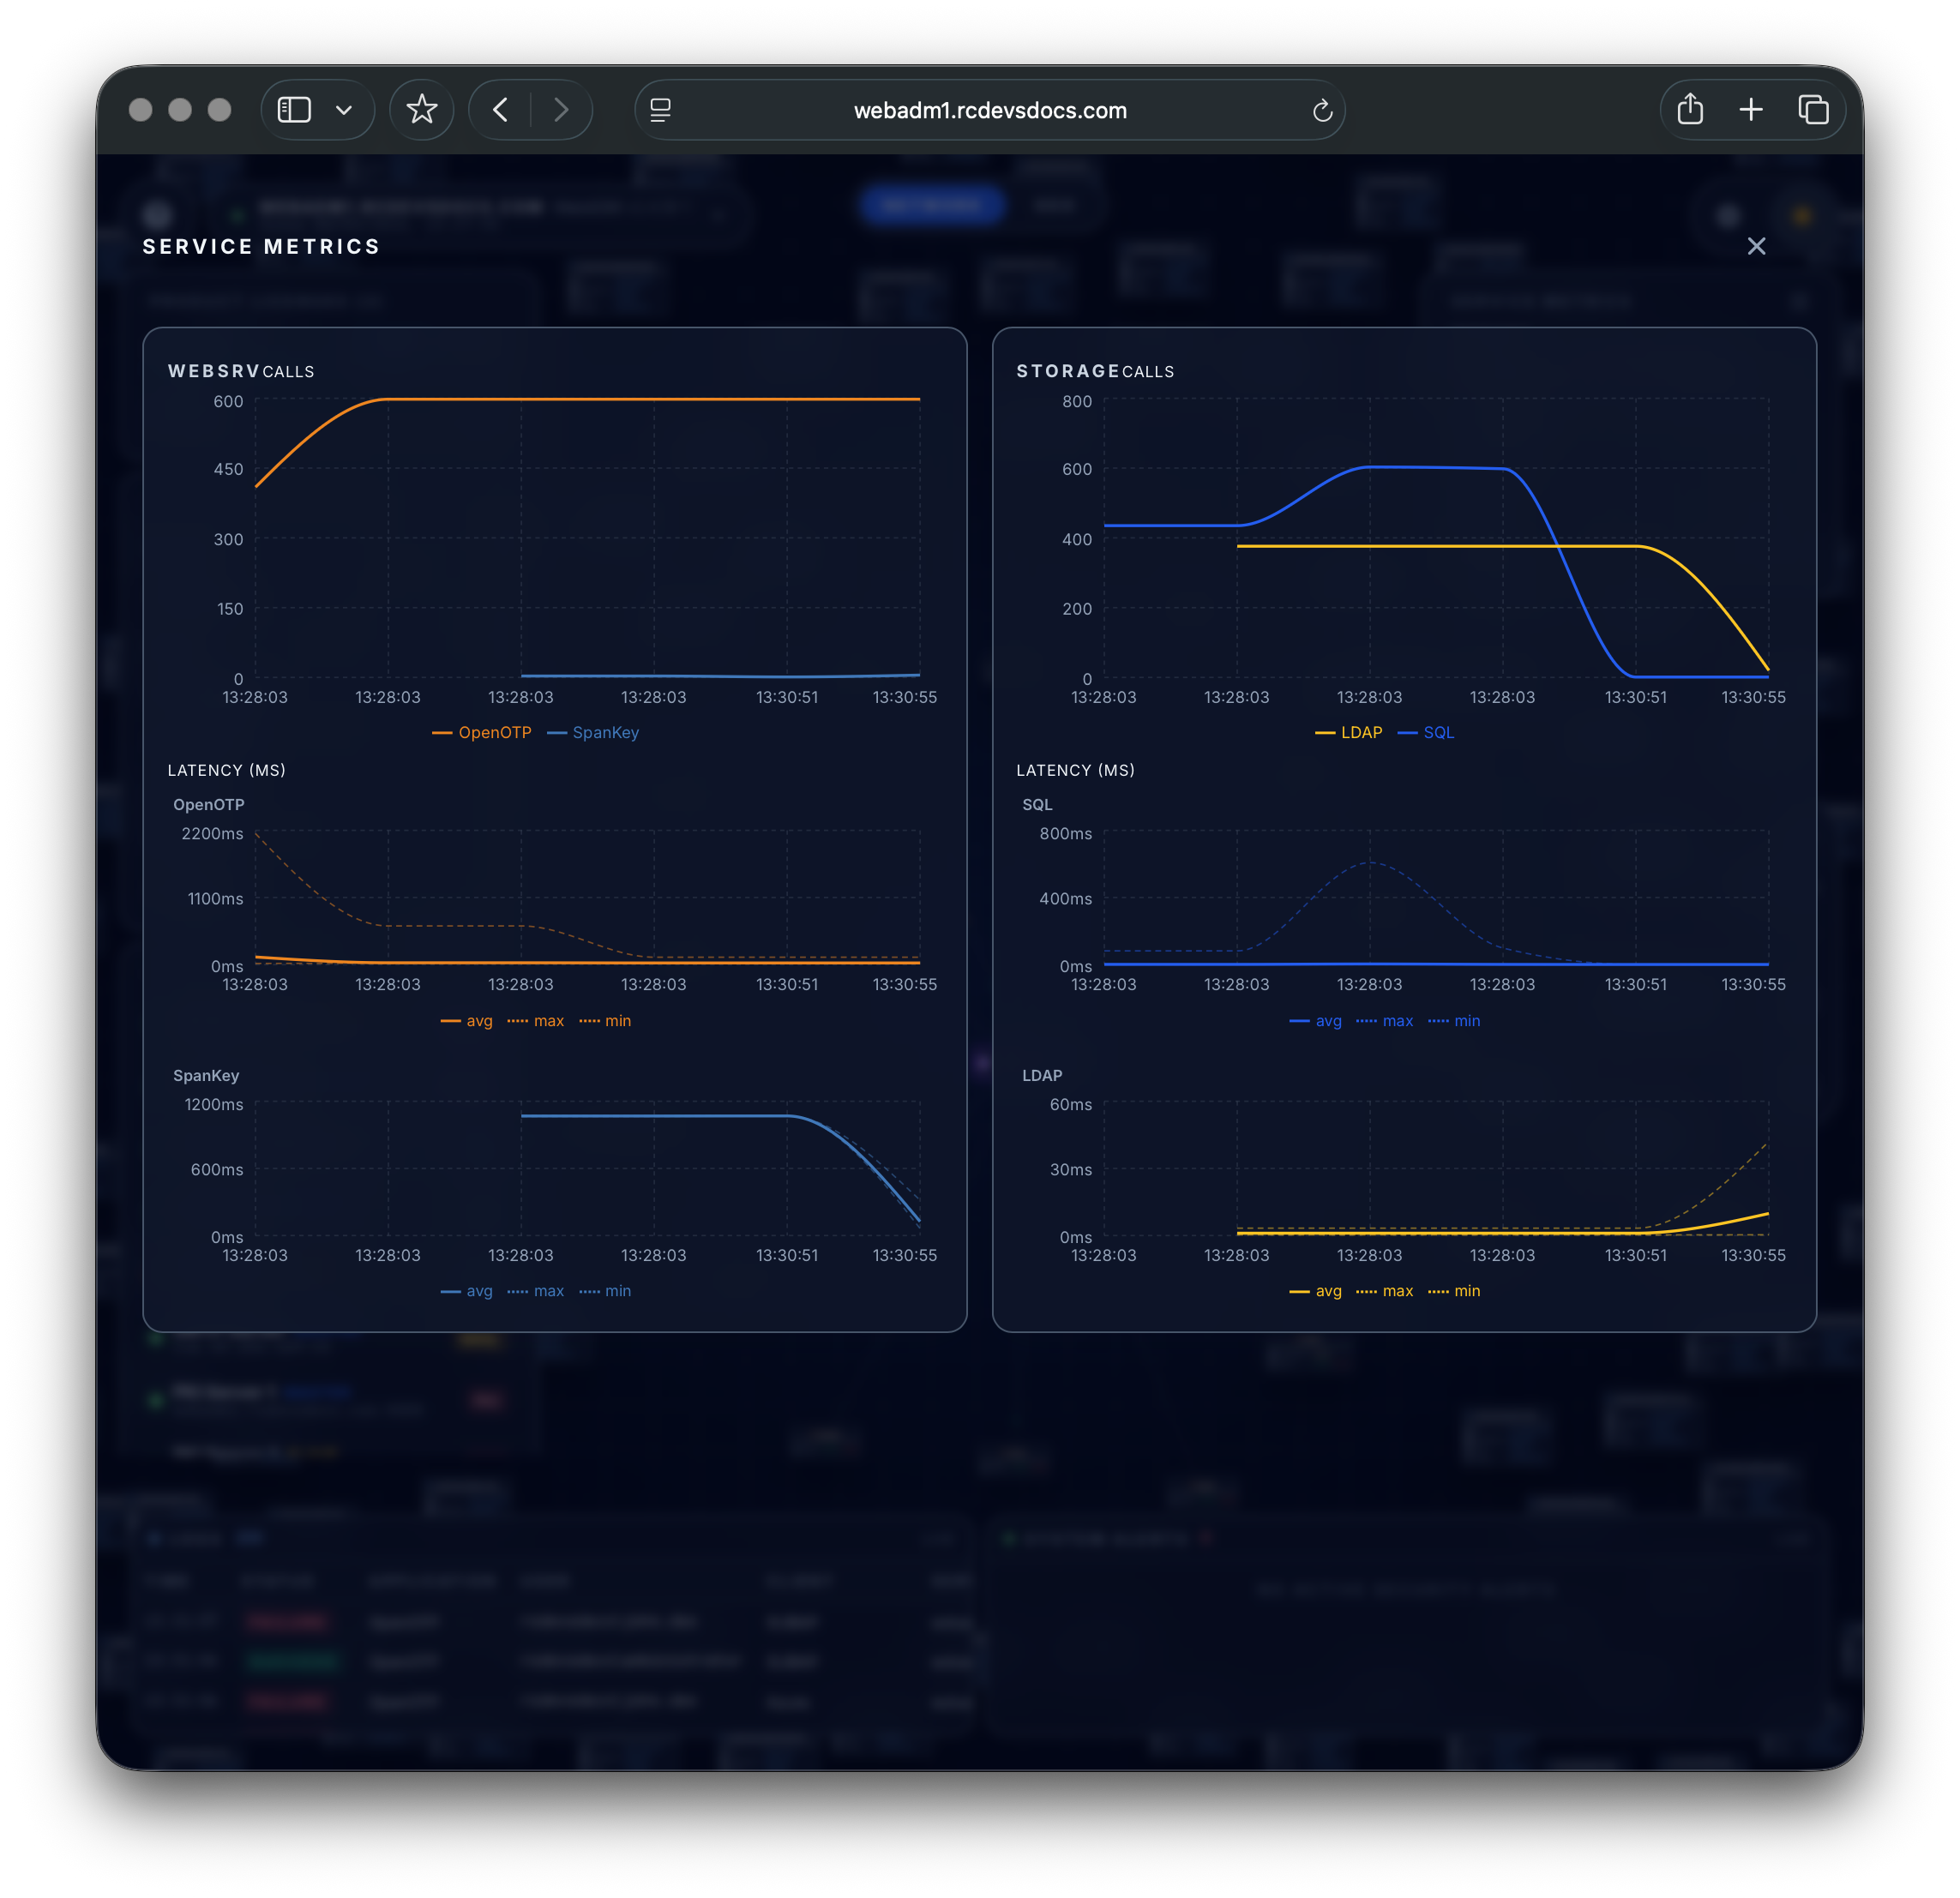
Service Metrics
Latency and throughput statistics for OpenOTP/SpanKey services and LDAP/SQL storage backends.